


What Behind the Scenes Action in Synthetic Paper Gold/Silver Markets is Forecasting for 2023
What Behind the Scenes Action in Synthetic Paper Gold/Silver Markets is Forecasting for 2023
And a whole lot of additional explosive findings

I’m going to discuss the above chart first and discuss its meaning and then present to you more data of behind the scenes behavior of the bullion banks (the group of Western global banks that incessantly manipulate gold and silver prices lower in the derivatives markets) at the current time. I will conclude this article by connecting the dots between these two sets of data and how they should be interpreted regarding predictions for gold and silver price movements for 2023. I’m nearly certain that this discussion will prove enlightening, no matter one’s level of familiarity, or as is more often the case, one’s unfamiliarity, with these sets of data.
JP Morgan House Accounts
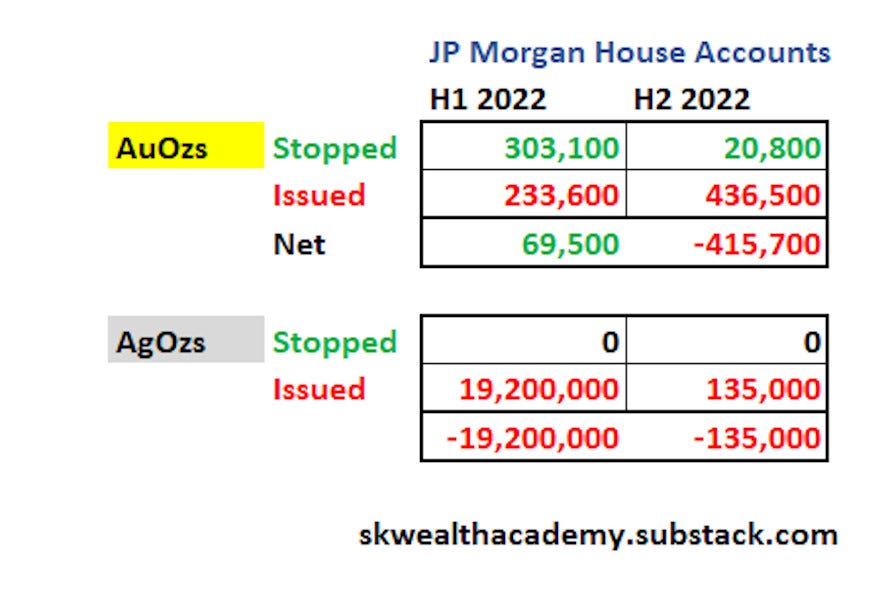
To begin, I start with only data from the house accounts of known silver and gold price manipulator JP Morgan because I’m intensely interested in PE #1’s behavior in regard to its in-house buying/selling of physical gold and silver. I’ve broken down the total amounts of physical gold and silver ounces issued and stopped by JP Morgan in their house accounts by the first half of this year (H1) and the second half (H2) of this year to date (6 Dec), so we can compare their behavior in H1 v H2. I calculated the total number of precious metal ounces simply by multiplying the numbers of contracts stopped or issued by the number of ounces represented per futures contract (100 AuOzs per gold futures contract and 5,000 AgOzs per silver futures contract).
For those unfamiliar with the lingo of derivatives, “stopped” means contracts for which JP Morgan requested physical settlement to close out the contracts, and thus represents received ounces, whereas “issued” signifies the amount of physical ounces JP Morgan had to deliver, and thus represents ounces that left their house accounts. Therefore, if the net figure of the issued versus stopped ounces is in green, this means JP Morgan received a net positive amount into their house accounts, but if the net figure is in red, this means that a net positive amount left their house accounts.
Let’s discuss gold first. In the first half, we see that JP Morgan received a net amount of 69,500 AuOzs, or roughly $123M of physical gold at December 2022 gold spot prices. However in the second half of this year, to date, JP Morgan delivered a net of 415,700 AuOzs out of their house accounts, a much more considerable $735.8M of gold. With silver, unlike with gold, JP Morgan was forced to deliver silver out of their house accounts both in H1 and in H2, delivering $425.5M, or nearly half a billion dollars of silver in H1 at December 2022 silver spot prices, and an additional roughly $3M of silver during H2 thus far. Here’s why this information, when connected to the additional compiled data I’m going to present, is so critical to understand.
Normally, one would interpret this data to be